population pyramids
Click to set custom HTML
This the population of Las Vegas, which makes sense since Las Vegas attracts younger people looking to have a good time.
This is the population of Boston, and the population in the years 20 to 24 is significantly showed, which can be to Boston area has lots of colleges.
This graph is based on the population of Chicago, it appears that Chicago has the most males and females in the late 20's and early 30's. These numbers could signify lots of people starting new lives with their partners.
Click to set custom HTML
This graph depicts the population of Los Angeles. In Los Angeles. In Los Angeles, people come to the city for many different reasons.
This graph depicts Modesto. This graph shows that a great number of the citizens in Modesto are quite young.
This is the population of Turlock. The population is around 2000 for all ages until around 60 for both men and woman.
This is the population of Manteca. This population is very similar to that of Turlock.
climate. gov 9/15/17
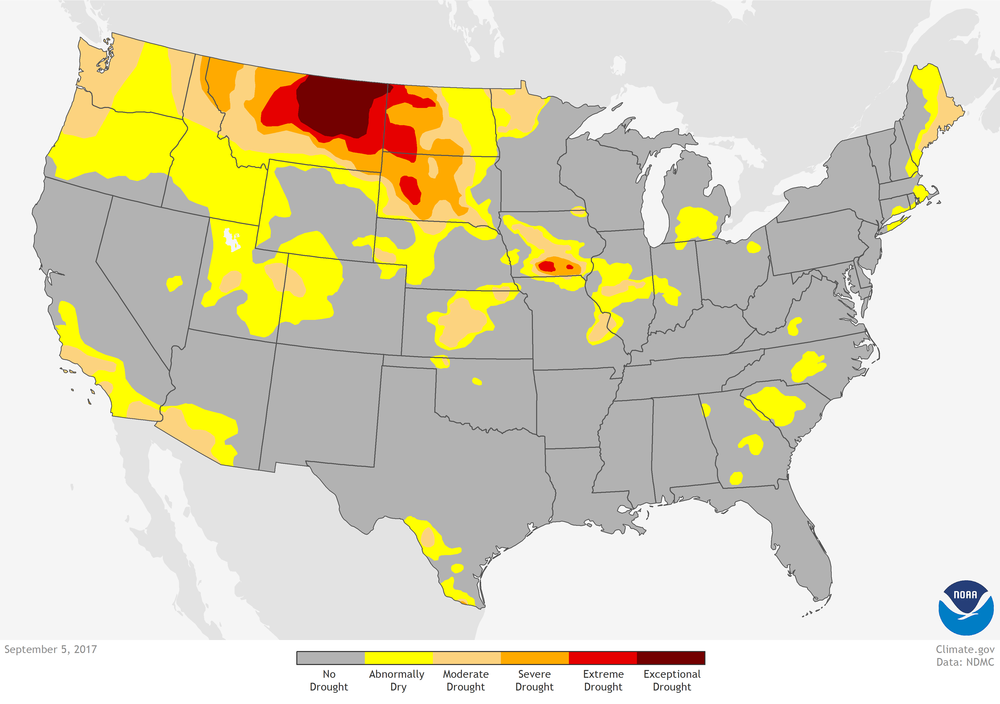
I find it quite interesting that the drought in California has drastically has changed compared to three years ago, where most of California was suffering from extreme drought, and some parts were even suffering form exceptional drought.
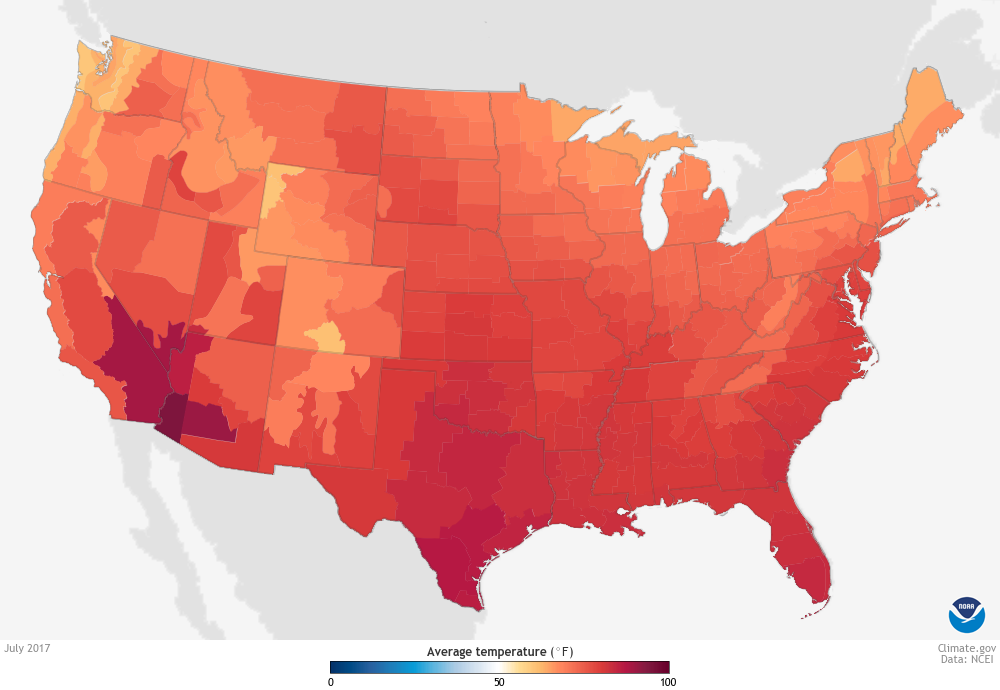
The whole country is above the average temperature, and probably will only keep on increasing in temperature.
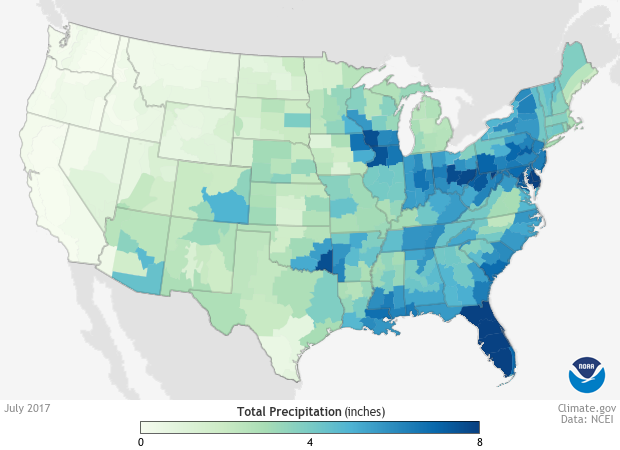
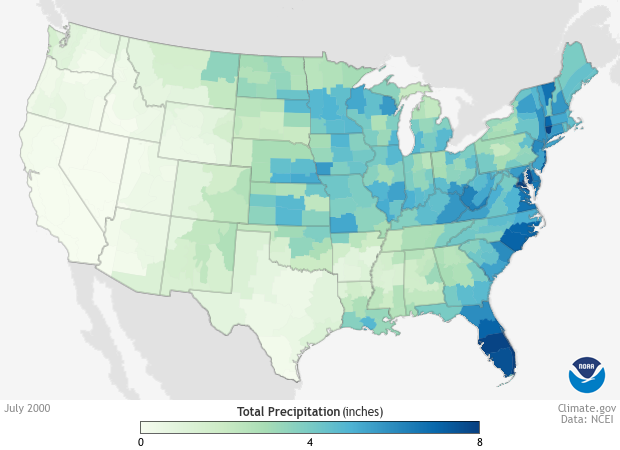
In 15 years, the level of precipitation ready hasn't changed that lot, and roughly has stayed the same.
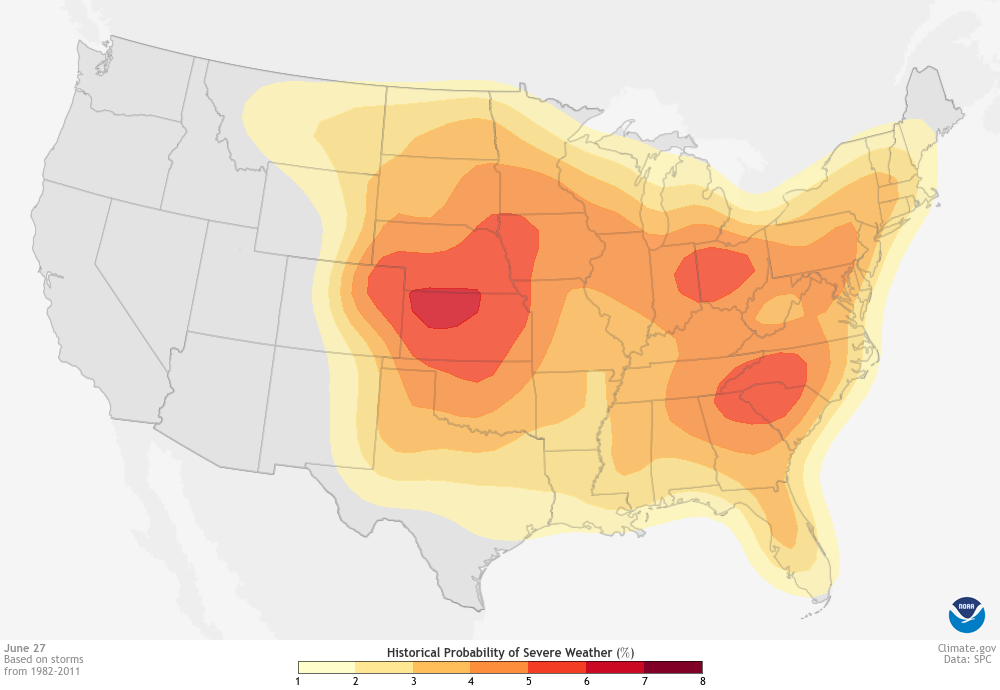
I observed that there is more chance of severe weather in the month of June, than in any of the other 11 months. Also, there is only really any threat during the summer, there is a great discrepancy when comparing.
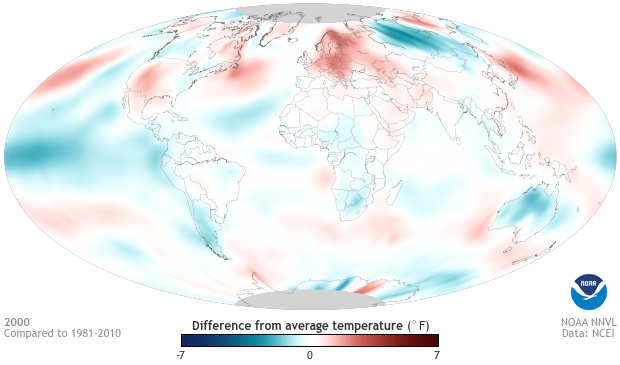

These two images compare the differences from average temperature, and by looking at these two images one from 2000 other from 2016. It's quite obvious by looking at this that we're experiencing a rapid change in the global, and it's all because of us.
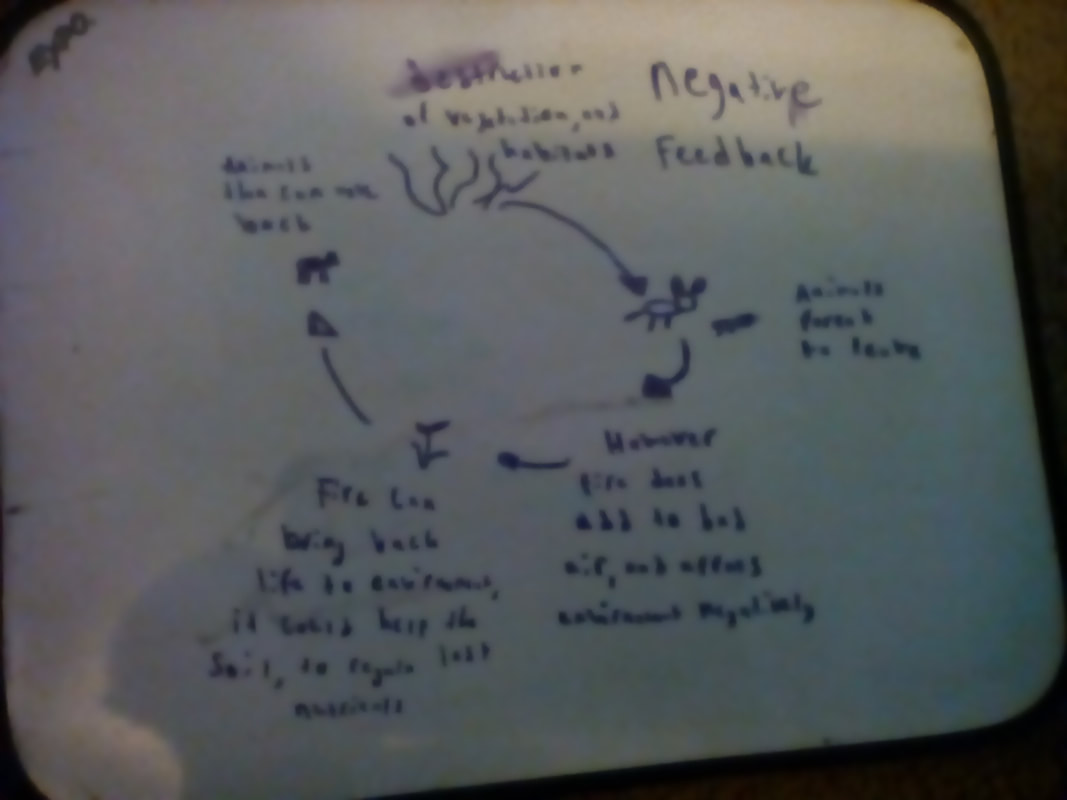
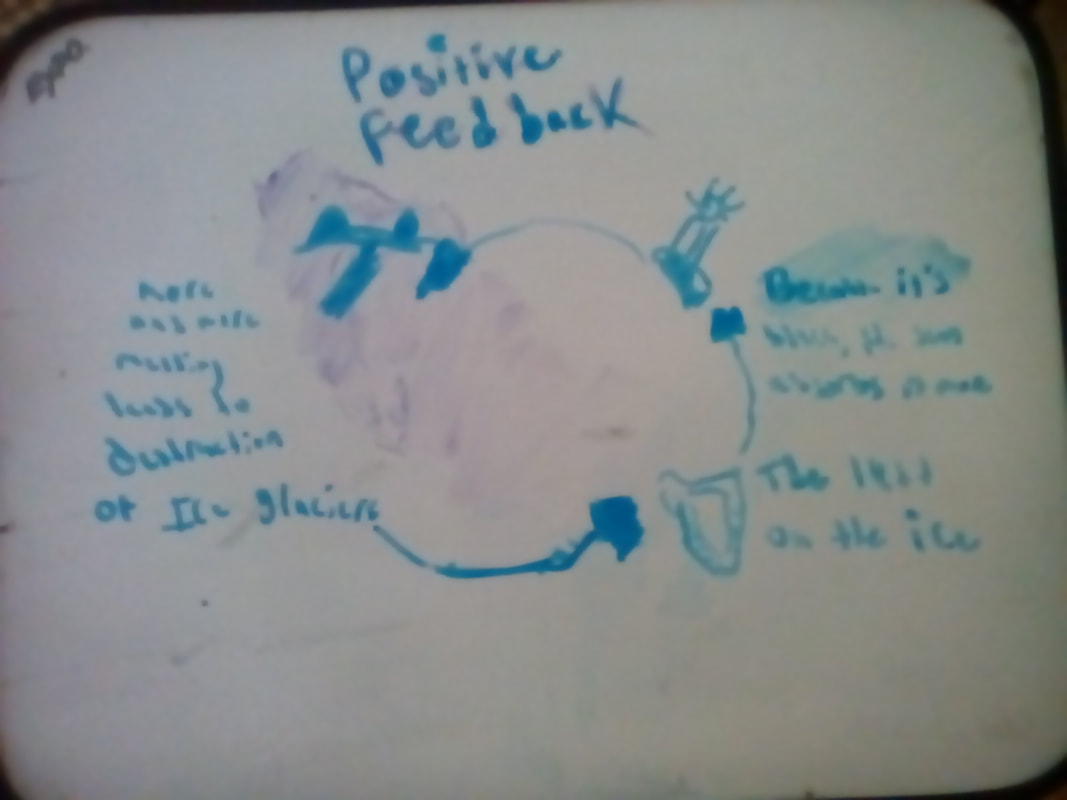
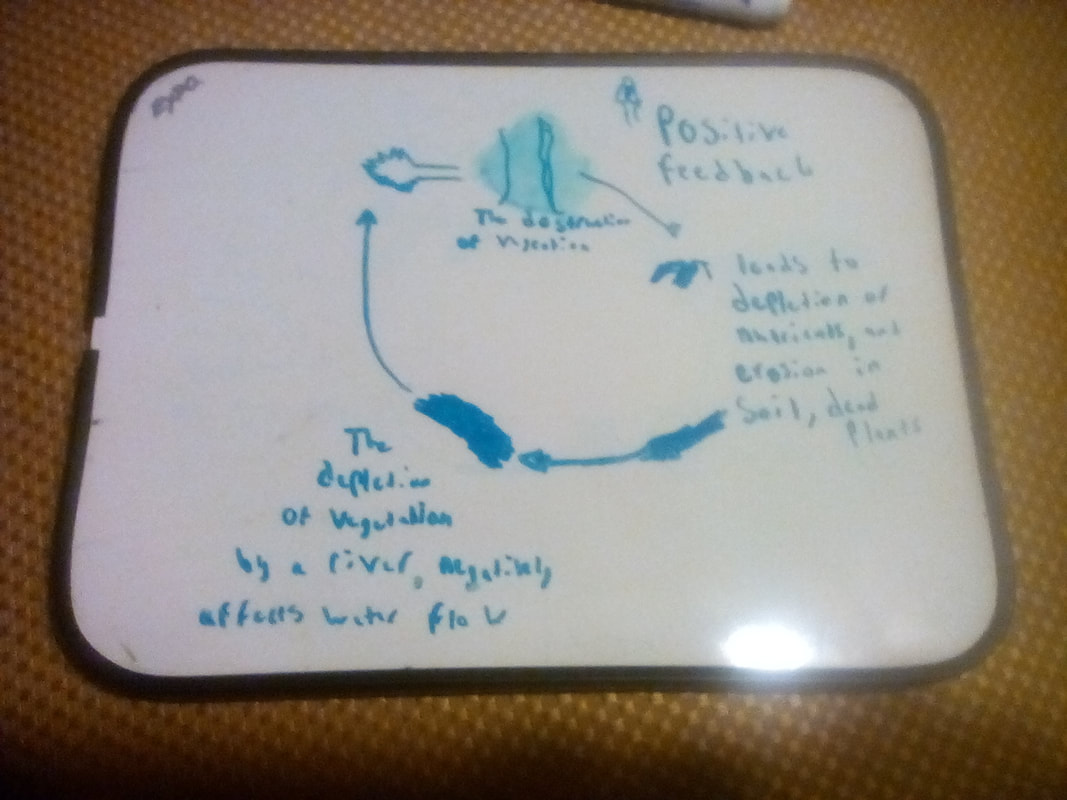
In class Negative or Positive Loops?
Species Diversity Lab
1. Identify the parking lot that was the most diverse. Based on your observations during the lab, explain why your
prediction in question #1 of the prelab was supported or not supported.
The most diverse parking lot was the student parking lot, there seemed to be lots of Toyota in the staff parking lot. While the student parking lot had jeeps, Lexus, Volkswagen and Mazda.
2. List the single most abundant species in each set of data, and write a plausible explanation to explain why these are
the most abundant species.
Honda's seem to be the most abundant overall. An explanation for this occurrence is that Honda's are relatively small cars that are good starting cars for High Schoolers. They are also decent on the gas mileage.
3. Determine the maximum and minimum values for the Shannon Diversity Index in the parking lot you surveyed.
The student parking lot has more diversity with a score of 2.5 Shannon Diversity, and 1.8 Shannon Diversity score in the staff parking lot.
4. If you conducted this lab in a shopping mall parking lot, predict whether the Shannon Diversity Index would be high or
low, and how it would compare to the school parking lots.
I would predict there to be more diversity of cars in a mall parking lot just for the reason that people of all social classes come to the mall, and thus different car years and makers.
5. If you conducted this lab at a new car dealership, predict whether the Shannon Diversity Index would be high or low,
and how it would compare to the school parking lots.
The Shannon diversity would be lower if you where conducting this experiment in a only ford dealership.
|
a. What were the degrees of freedom used in this exercise? 6
c. What is the calculated chi-square (x2) value? 79.23 d. Do your results indicate that it was chance alone that caused the unequal numbers of capture wooly worm phenotypes ? Explain. Its not random. The degree of freedom is saying that results are significant and are all the way to the left in being considered significant. e. Which colors of worms were subjected to a positive selection pressure? Which colors of worms were subjected to a negative selection pressure? Explain. The worms that were green like olive garden were less easy to find in the grass, than fire lash and rainbow dash which was easy to spot in the grass because of its popping colors. f. What do these results indicate might happen over time to this wooly worm population? This means that the worms that are better camouflaged are less likely to be prey than those worms of bright, standing out colors. g. Consider feeding times, feeding habits, ability to see color, vision acuity, and other possible characteristics of predatory birds in nature. How might such characteristics determine selection of certain worm colors? It would want to blend in to their environment of green to appear to predators apart of the grass. h. Consider the school grounds upon which you "feed" on your wooly worms. If this particular environment remained changed over a very long period of time, how would the population change? What would the community look like in ten years? The community would be in greater amounts of green worms than the worms who have more bright and more easy saw colors. TrashBag Collection


|
In this sheet there is the student parking lot data, and the animal kingdom data.
|
